Our Maps
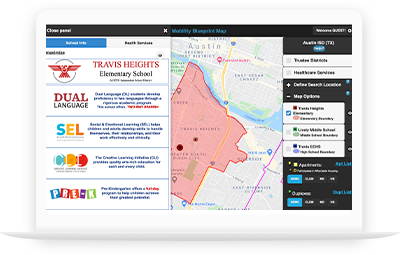
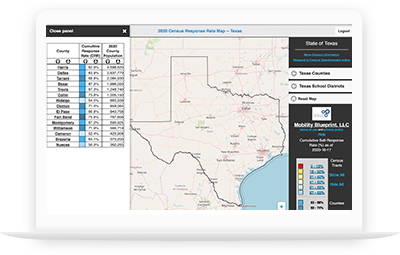
Mobility Blueprint uses geocoding to map school district and school boundaries along with real-time affordable housing and school and community services on innovative, adaptive platforms that are created to address specific needs within the community.
More Resources
Mobility Tools
Family & Community Resources:
- Custom School Flyers
- How to Use Mobility Blueprint (English/Spanish)
- Community Presentation (English/Spanish)
- Family Transfer Checklist
Core Team & School Staff Resources:
- Core Team Training Presentation
- School Webinar Presentation
- Monthly Newsletters
- Mobility Blueprint Information Sheet
- School Outreach Plan
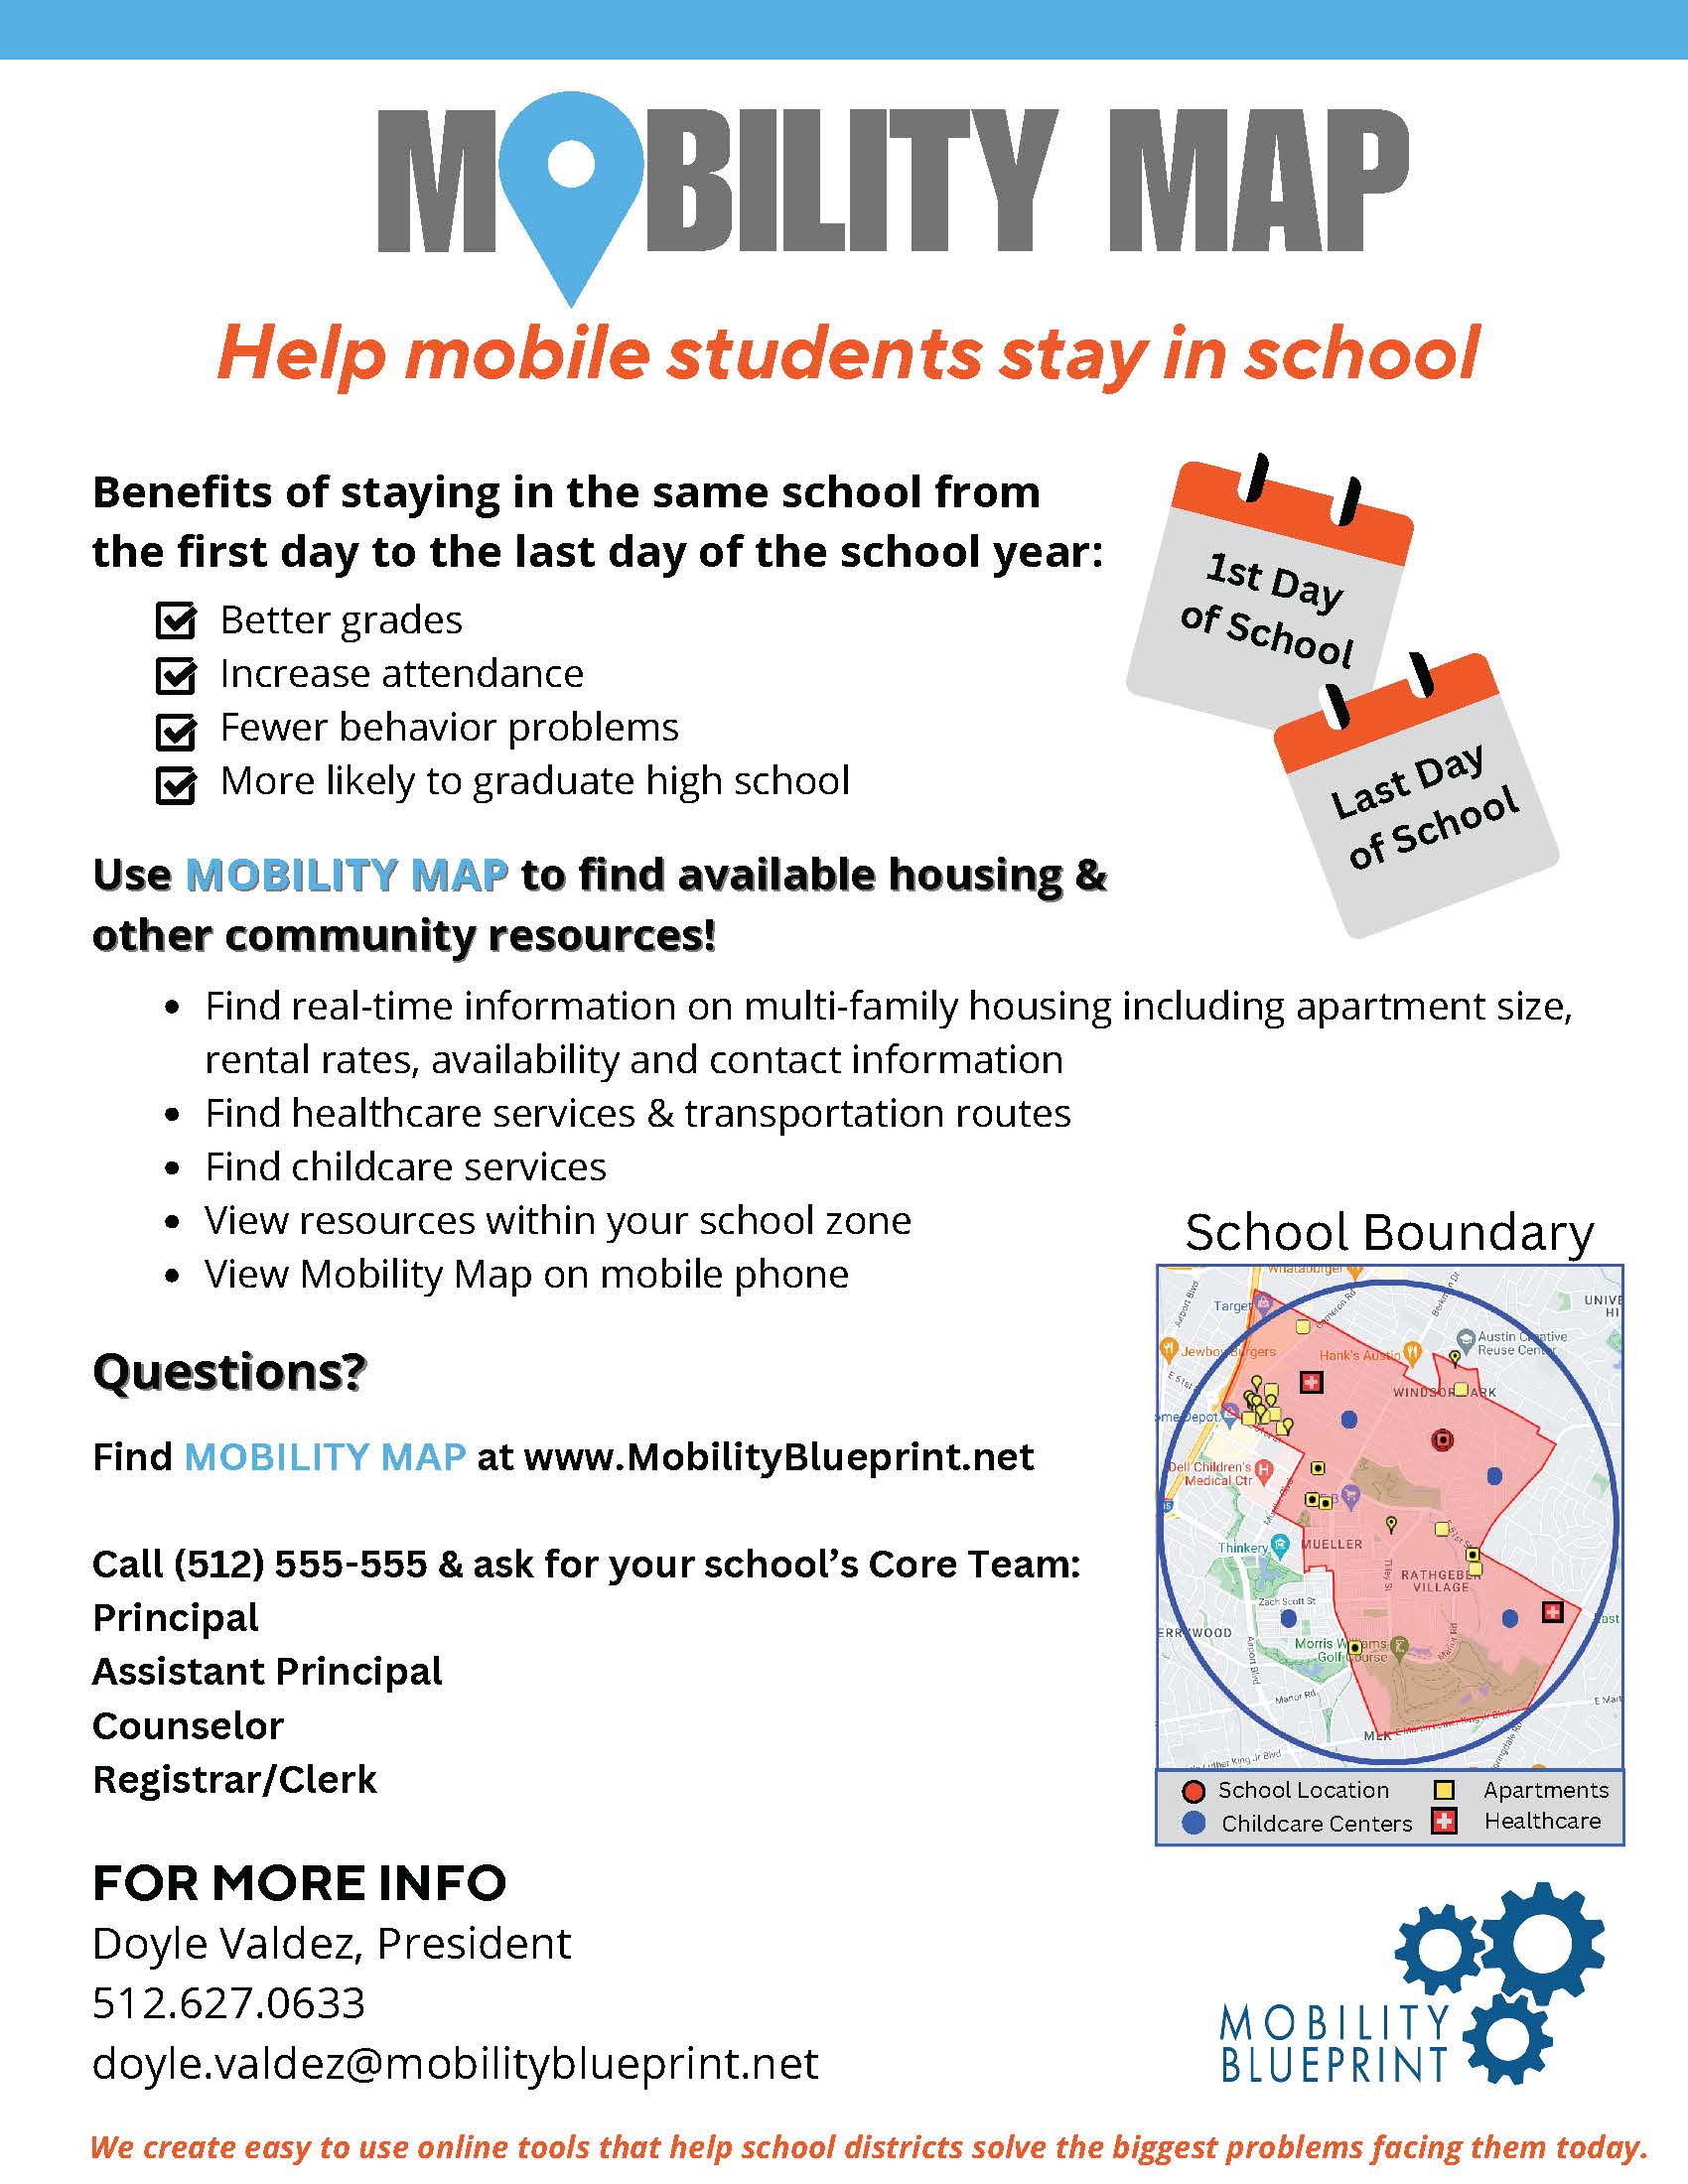
Sample Flyer:

The Data
An expanding body of evidence shows that high rates of school mobility are linked to negative outcomes in multiple spheres of a student’s life.
What is student mobility?
Student mobility is defined as any time a student changes schools for reasons other than grade promotion. Student mobility can be:
- Voluntary
- An intentional decision to move
- Example: to participate in a new program
- Involuntary
- Expulsion
- Residential
- A change in living situation that requires a student to change schools
- Example: homelessness or change in a parent’s job
How does student mobility affect schools?
- Teacher effectiveness – Students entering and leaving classrooms throughout the school year disrupts effective teaching.
- School culture & family engagement – Families and children may find it difficult to build relationships with their school community if they are changing environments repeatedly.
- School accountability ratings – High mobility rates affect student attendance, academic performance and graduation rates.
How does student mobility affect school districts?
Example: If District A has 80,000 students and a mobility rate of 18%:
- 14,400 students change schools in District A during the school year.
- Mobile students miss an average of 6 days every time they change schools.
- District A students miss 86,400 days of school due to mobility.
- District A loses approximately $3,888,000 in annual revenue due to student mobility (Assuming Weighted Average Daily Attendance is $45).
How does student mobility affect students?
- Mobility disproportionately affects economically disadvantaged students
- Studies show student mobility is associated with:
- lower school engagement
- poorer grades in reading and math
- higher risk of dropping out of high school
- Students generally lose 3 months of reading and math learning each time they switch schools.


